

Every campaign data vendor will sell you a turnout score, 0 to 100. Far fewer will tell you whether it’s any good. Most of the time, it isn’t.
A lot of state vote-history files are a participation ledger: one row for each election a voter turned out for, nothing for the ones they skipped. New Jersey’s statewide file works this way. Divide a voter’s ballots by the rows the file carries and everyone who has voted once looks like a 100% turnout voter. The “model” puts almost the whole file in the top bucket, which is useless when the point was to decide who needs a knock.
Measured against the calendar, not the file
Romulus divides ballots cast by the elections that actually happened in the voter’s jurisdiction since they registered. A missing row is a skipped election, and it counts as one. That is the difference between a score that separates reliable voters from occasional ones and one that calls everyone reliable.
On day one, Romulus scores your whole file with defaults built on recency, frequency, and the shape of a voter’s history. It also records how many elections each score rests on. A 0.5 built from two elections is not a 0.5 built from twenty-two.
A score that grades itself
When you’re ready, Romulus fits a model to your electorate and grades it. It holds out one real past election, scores every eligible voter using only the elections before it, and checks the prediction against who turned out. You get how cleanly the score separates voters, how well its probabilities match reality, and the lift in the top slice of the file, all measured on voters the model never trained on and set next to the default weights on the same voters.
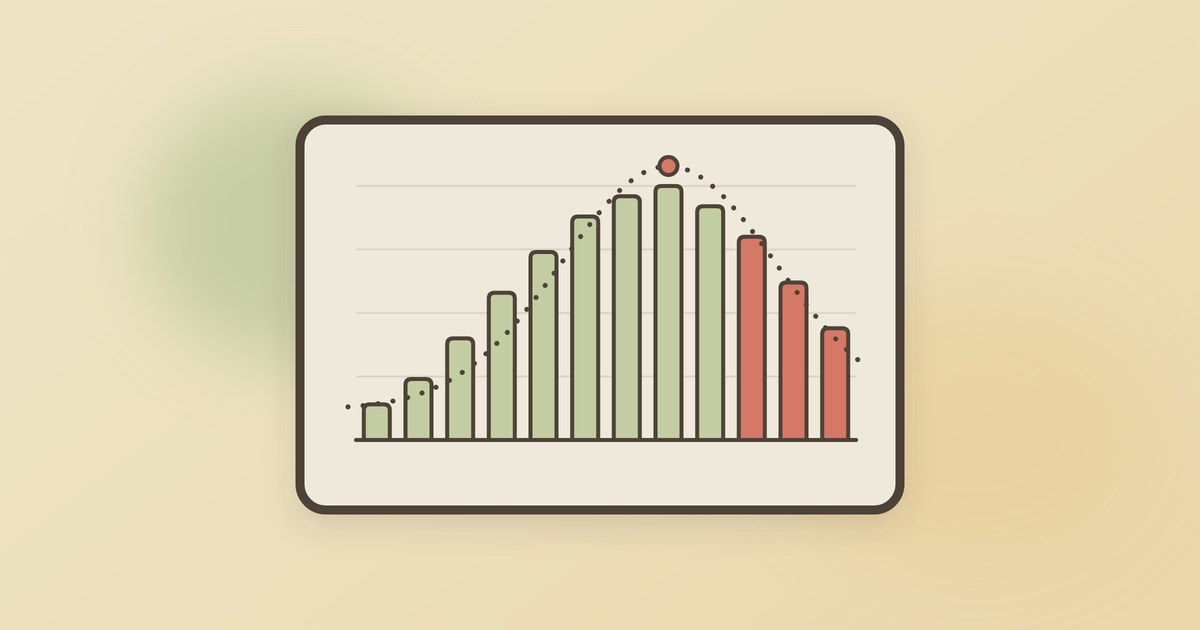
Nothing is promoted automatically. You read the comparison and decide. Publish a model and every turnout score becomes a calibrated probability, so the score histogram and the “likely / persuadable / unlikely” cutoffs mean what they say.
No peeking at the future
Features come only from elections before the one being predicted. Voters who registered after the held-out election are dropped. A voter’s current support ID is left out, because you learned it after the election; leak it in and the score looks brilliant in testing and falls apart in the field.
Primaries and generals also turn out differently. A model graded on a general keeps its ordering against a primary electorate, but its raw numbers read high, so Romulus lets you grade against the election type you’re targeting.
From a hunch to a model
None of this requires a data team. The Scores library puts every number you carry on a voter (vendor columns, imported CSVs, in-house models) on the same 0–100 scale, so cutoffs, crosstabs, and sorts behave the same across all of them. Rosie, the campaign assistant, drafts a model from plain English: describe who you think turns out, and she lays it out as toggleable assumptions, each with a confidence you can dial and a training pool that recounts live. The trained report shows the weight you assumed next to the weight the data learned.
A live model re-scores nightly as new vote history and contacts come in.
The full detail is in the docs under Scores & models.