Reviewed September 24, 2026. Features depend on your enabled modules, permissions, and configured integrations.
Tip: permissions
view_analytics with the analytics feature. Fundraising cards additionally need manage_fundraising. Public share links are a separate, deliberately enabled sharing surface.
The eight sections
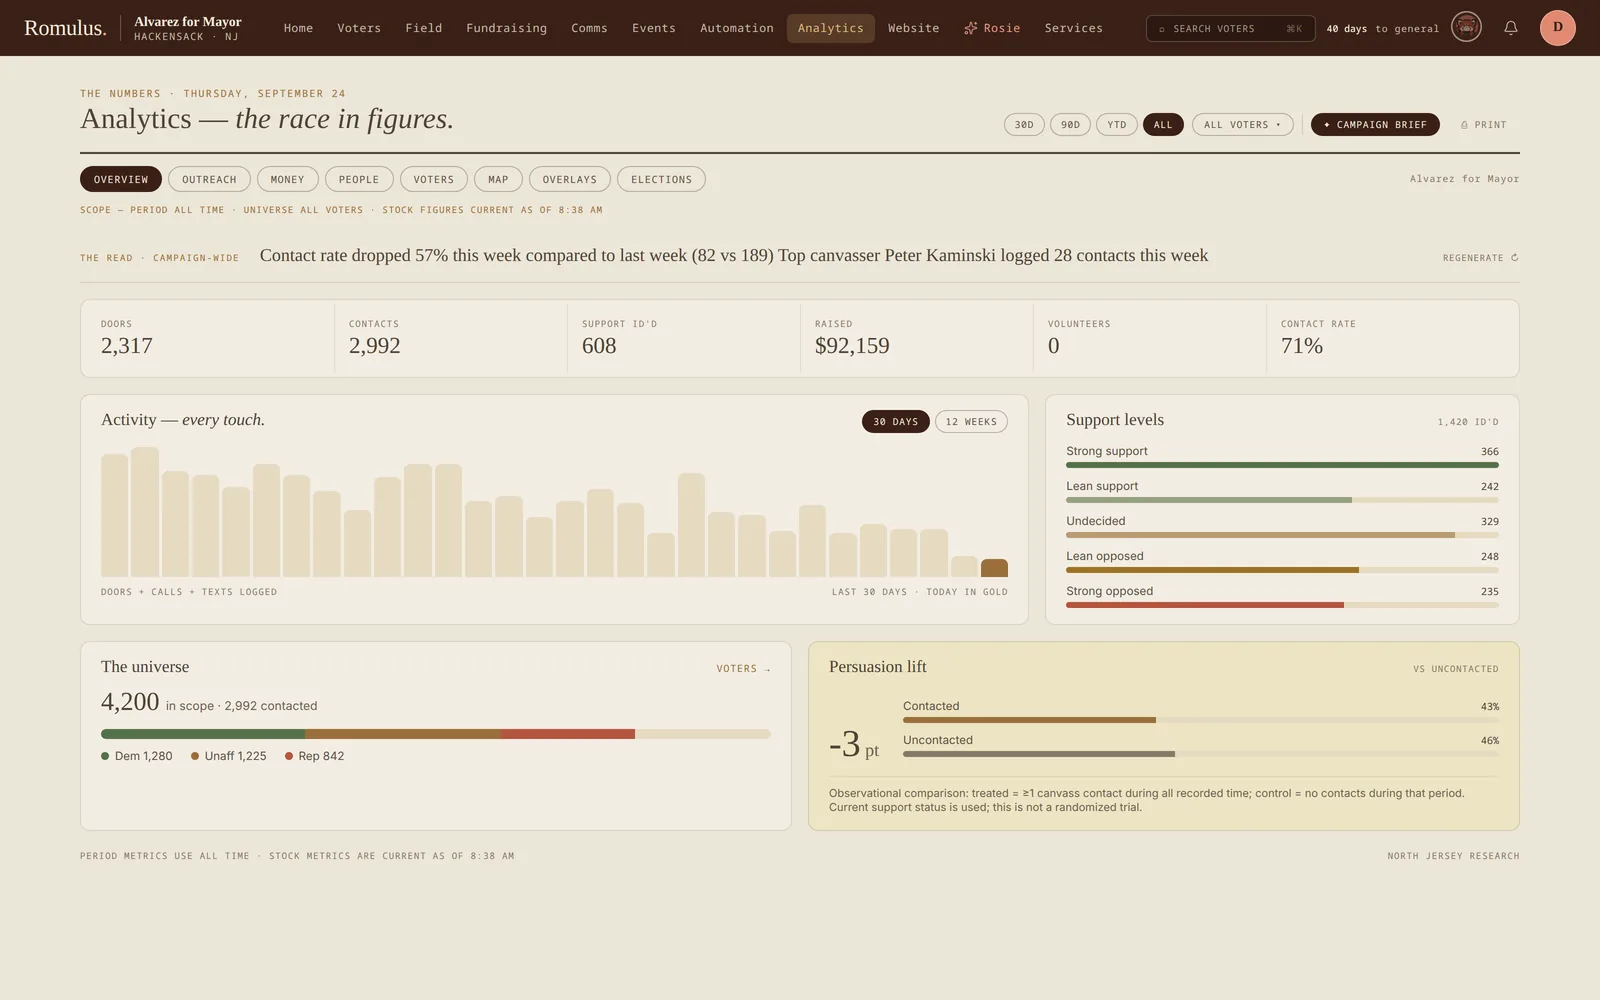
Two are worth a second look. The party breakdown in Outreach catches blind spots: only knocking one party's doors is the kind of thing you want to see in week three, not week 12. And persuasion lift on the Overview compares support among voters you have contacted with those you haven't. It says on the card that it's an observational comparison, not a randomized trial, so read it as a signal rather than proof.
Period, universe & brief
The layout is fixed, so everyone on staff reads the same page. The toolbar sets the period (30 days, 90 days, year to date, or all time) and the universe, and Print gives a printable copy. Campaign brief asks the campaign's AI to write up the numbers, which needs AI turned on.
Each section states its scope at the top: which period and universe apply, and which figures are current totals whatever the period. Period activity uses event dates; current totals remain current totals. Read the metric labels rather than treating every card as a comparison against the selected prior period.
Models & scores
Counting what's happened is one half of analytics; estimating what's likely is the other. The Modeling desk fits in-house models on your own voter file and canvass IDs (logistic regression under the hood) for turnout and for each candidate's support, then derives Persuade and Mobilize lists from them. Every voter gets a 0–100 score, and the desk grades each model against an election it didn't see before you publish it. Those scores don't hide in a report you forget about. They come back as filters and columns in the voter file, and a universe can target everyone above a line ("turnout score 60-and-up in Ward 3").
The full walkthrough (building a model, grading it, publishing it) lives on the Voters guide; here it's enough to know the scores feed the same dashboards and universes as everything else.
Elections, under Analytics, reads the other way: past elections by precinct, from the returns NJR imports for your area. Those results also drive the Precinct result criterion in the universe builder, so "precincts where we got 60 percent or better last time" is a real audience. Ballot matchback for the current election lives in the Field guide.
Saved reports, sharing, export
Use the report builder and domain-specific reports for fundraising, field activity, and other supported data sources. Export and sharing options vary by report; use the controls offered by that screen.
The dashboard does not promise a CSV and PNG export from every card. Treat a public share link as a deliberately shared surface and review its contents and access settings before distributing it.